Getting started with Iogram
In this tutorial we will build a simple Iogram project that renders meshes in a scene, and then export that project to a standalone application. If you're looking for Iogram's "hello, world" you've come to the right place!
Launch Iogram Editor
The Iogram editor is a tool that lets you create and edit Iogram projects. Iogram projects can be exported as standalone applications.
To use Iogram, launch the executable named IogramEditor (IogramEditor.exe on Windows) on your platform of choice. For example, on Windows, use Windows search to find and launch Iogram, or double click the Desktop icon. On Ubuntu, double click the IogramEditor executable in your Iogram_Linux folder, or alternatively run it from the command line.
Create a new project
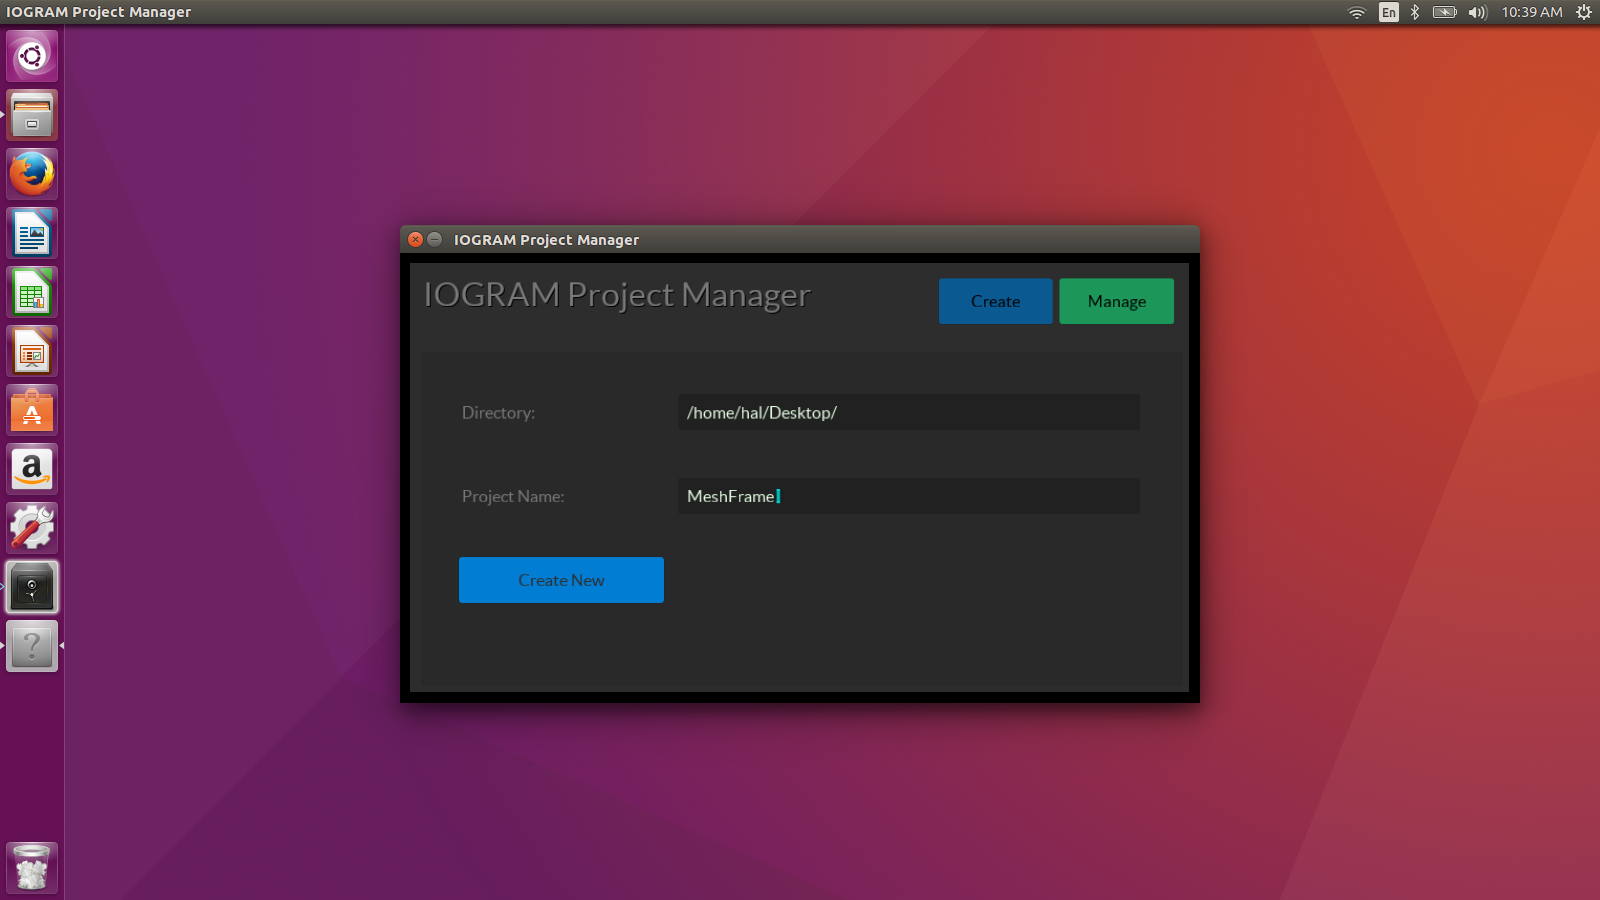
When the editor launches, you will be greeted by a project dialogue that lets you create a new project or open an existing one. To create a new project, choose the directory in which you wish the project to reside, and type a name for your project.
In our example, we have chosen to name our project "MeshFrame" and to save it on the user's Desktop. When you click "Create New", a folder with the name MeshFrame will be created in the project directory.
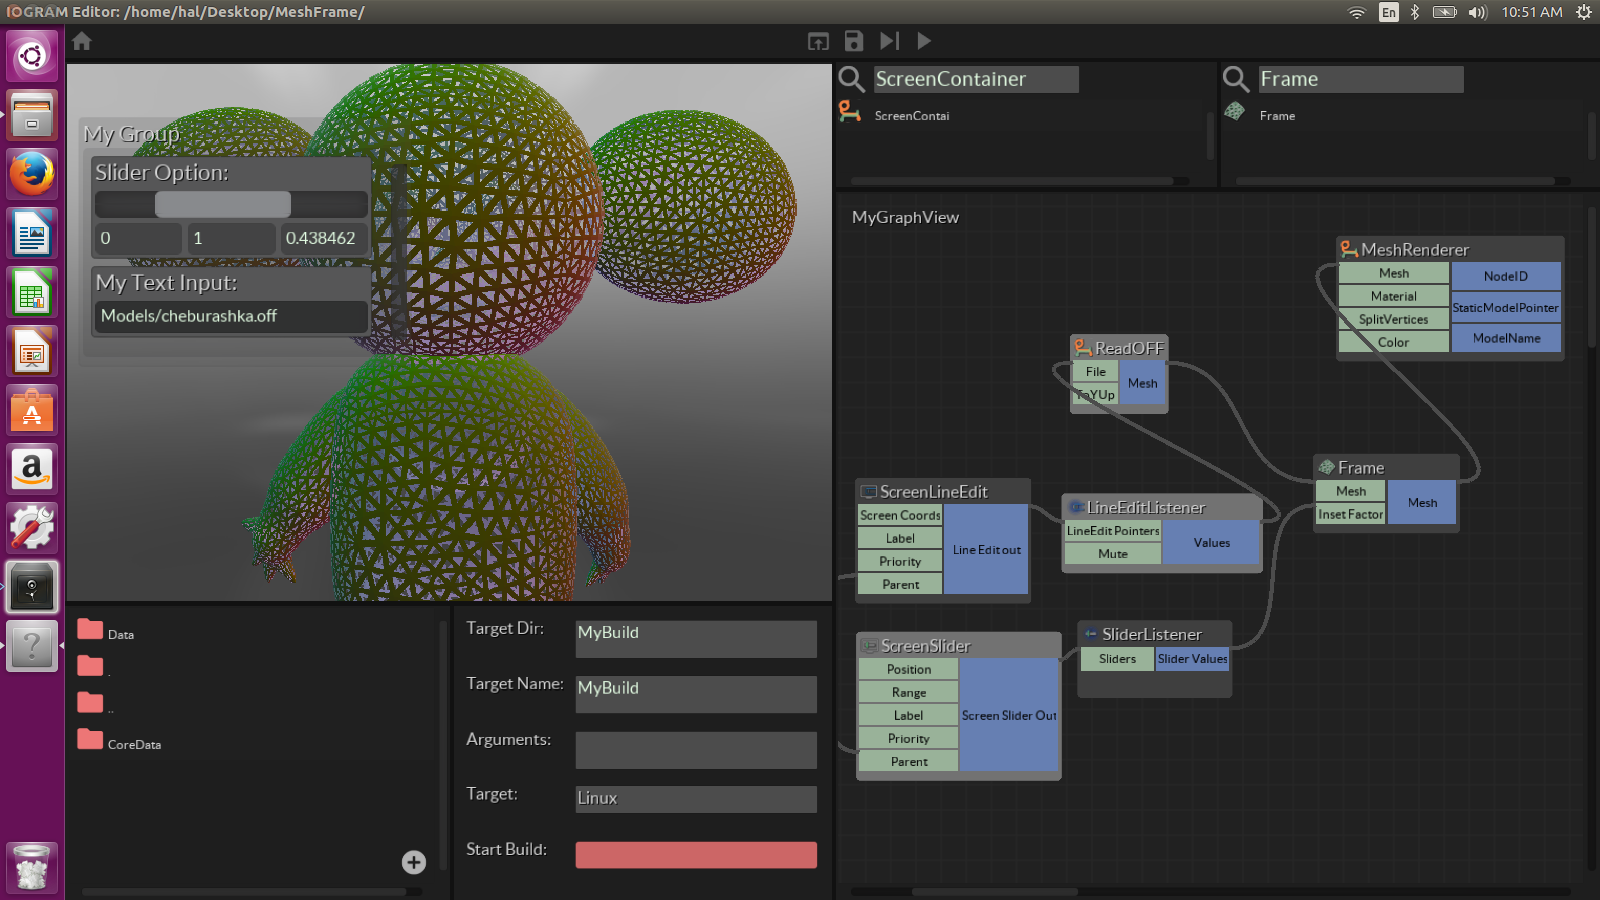
Get to know the Iogram Editor workspace
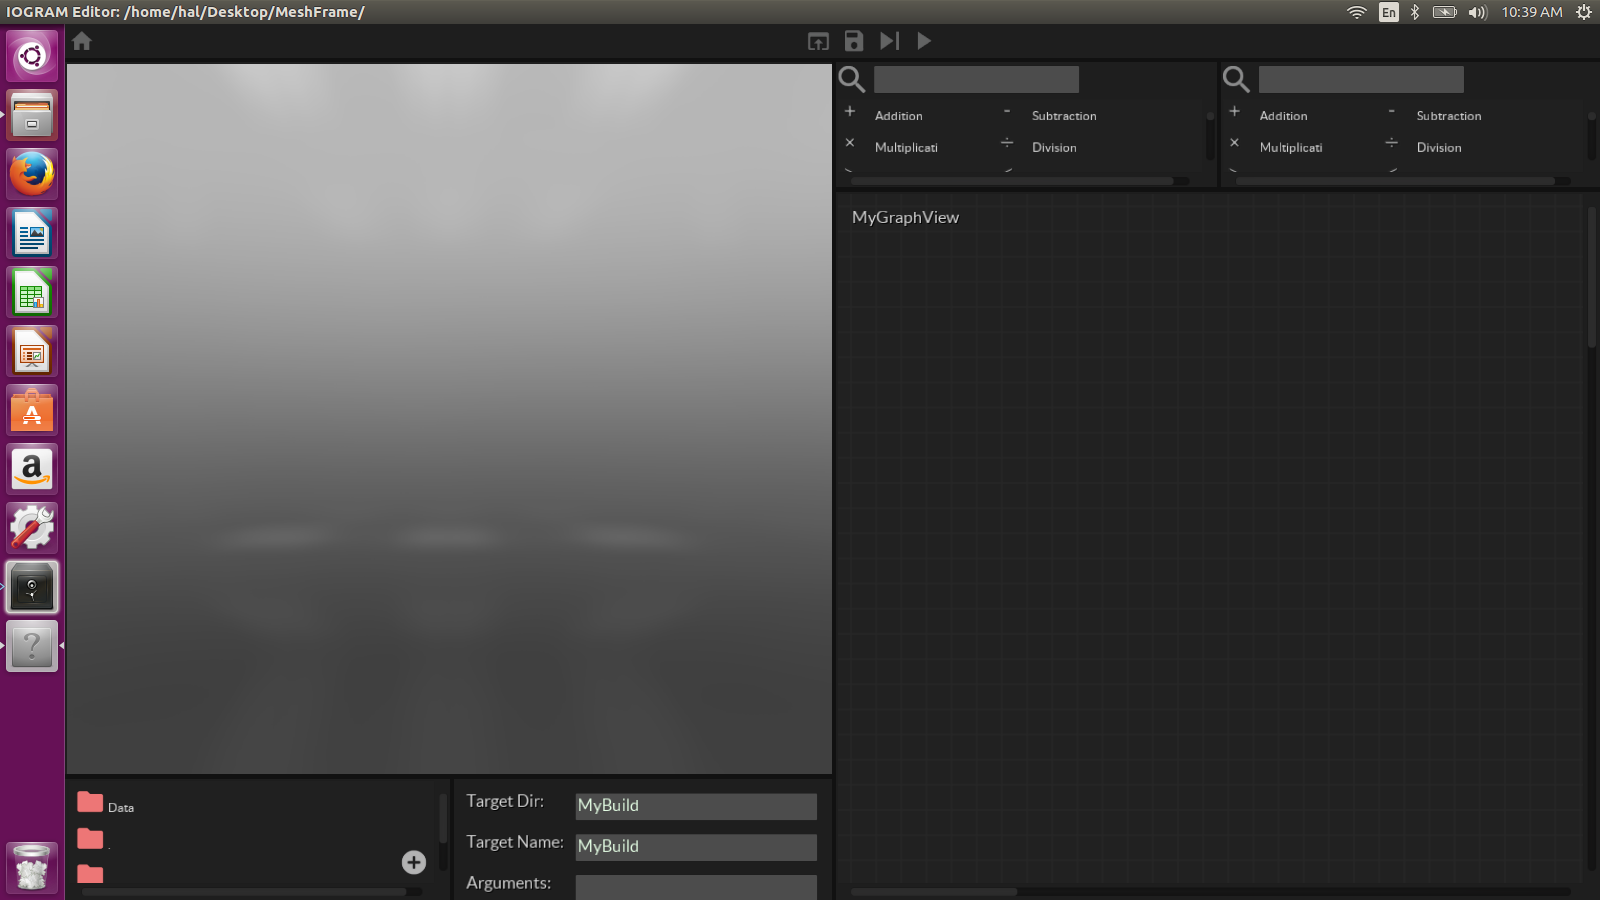
When you create a new project, you will see a blank Iogram workspace. The workspace is highly customizable, but by default you will see
a 3D scene view (top left)
a file explorer (extreme bottom left)
a build menu (bottom left)
a graph view (bottom right)
and two component libraries (top right and extreme top right).
A border divides each workspace view according to a recursive splitting pattern -- but to get started try dragging a border or two to resize the views. You will get a feel for how the views are arranged.
Drop a component onto a graph view
The core of an Iogram project is its component graph. To start building the graph, we will add the first component to our component graph. Our graph has the default name "MyGraphView". We will keep that name in this tutorial, but keep in mind that you can change the name, and you can create multiple views to organize your work on a graph.
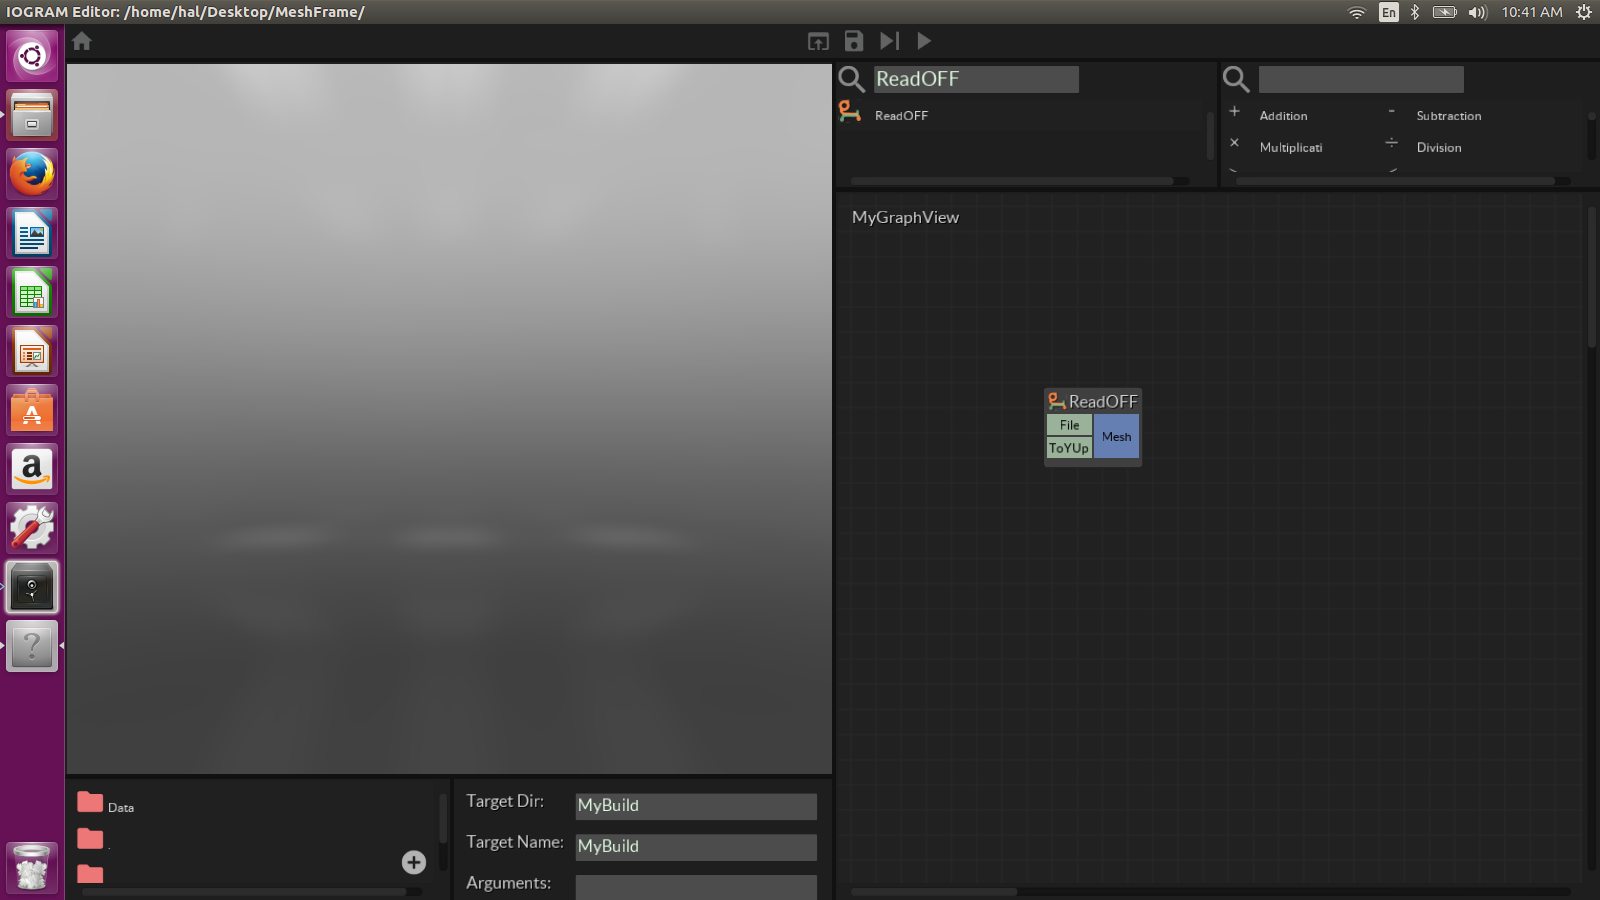
In the search bar of one of the component library views, type "ReadOFF". The complete list of components disappears and only components relevant to your search are in the library now. In our case, there is only one. Left click and drag the ReadTriangleMeshcomponent onto the graph view, and the component will appear in the graph view.
Save your work by clicking the save command in the middle of the command bar across the top of the editor. The icon for the save command is a floppy disk. Save your work often!
Load a mesh asset and render it in the 3D scene view
Right click on the input labelled "File" and type "Models/bumpy.off". Go back to your search in the component library and search for "MeshRenderer". Drag a MeshRenderer component onto your graph view. (Tip: you can use the shortcut Alt + m in the graph view to instantly drop a MeshRenderer component!)
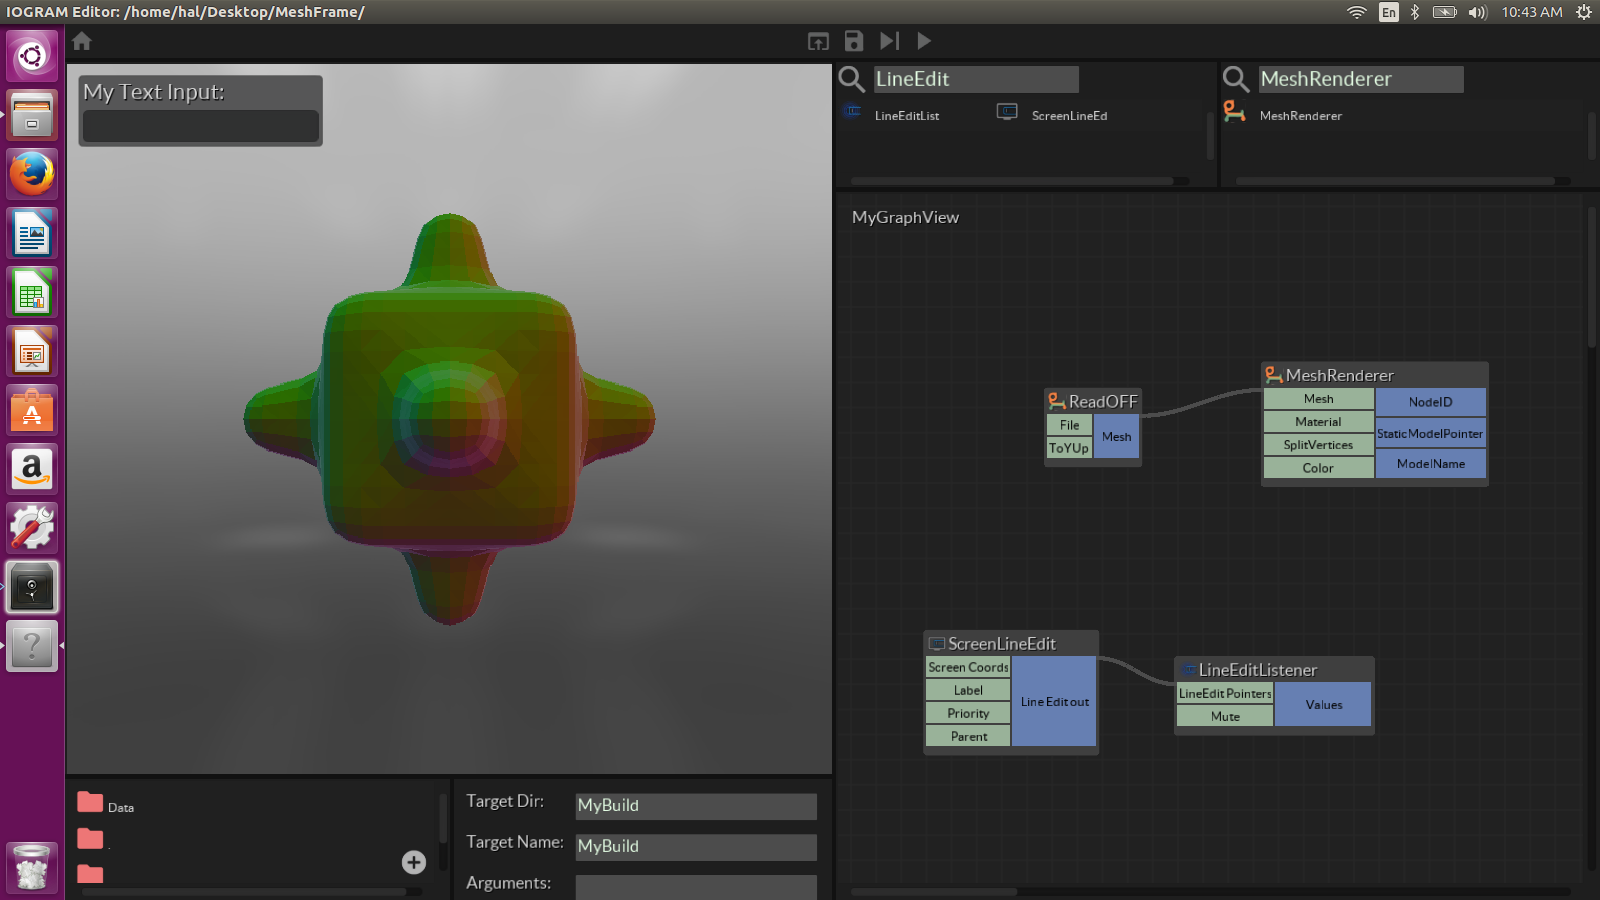
Join the "Mesh" output of the ReadOFF component to the "Mesh" input of the MeshRenderer component. You can do this by left clicking in the blue "Mesh" output slot of the ReadOFF component and dragging the mouse to the green "Mesh" input slot of the MeshRenderer component.
Now you should see some action in your 3D view. The MeshRenderer takes a triangle mesh as input and renders it in the scene.

You don't have to use "bumpy.off". You can use any OFF file (Object File Format) you happen to have lying around, and many other formats too. A great source of OFF files is our favorite open source C++ geometry processing library libigl, which you can findhere.
In the extracted folder libigl-master/tutorial/shared you will find a collection of great meshes stored as OFF files, and more. You can of course use any OFF file you have. We will use "cheburashka.off".
Now, if you just enter the full path on disk to "cheburashka.off", your Iogram project will find it and render it in the scene with no problem. However, you will want your exported applications to have access to the "cheburashka.off" asset as well. The simplest way to ensure this is to copy the "cheburashka.off" file into your project's Data folder. Specifically, copy "cheburashka.off" into the Models folder at MeshFrame/Data/Models. (You won't find "bumpy.off" here, by the way, because it's part of the CoreData shared by all Iogram projects.)
As you will see, there are folders for many custom resources and assets you might want to include with your exported applications, including Scripts, Textures, Fonts, and more. When you store your files in a project's Data folder, you ensure that not only this particular Iogram project but also the exported applications created from it will have access to those files.
Allow the application end-user to choose the mesh
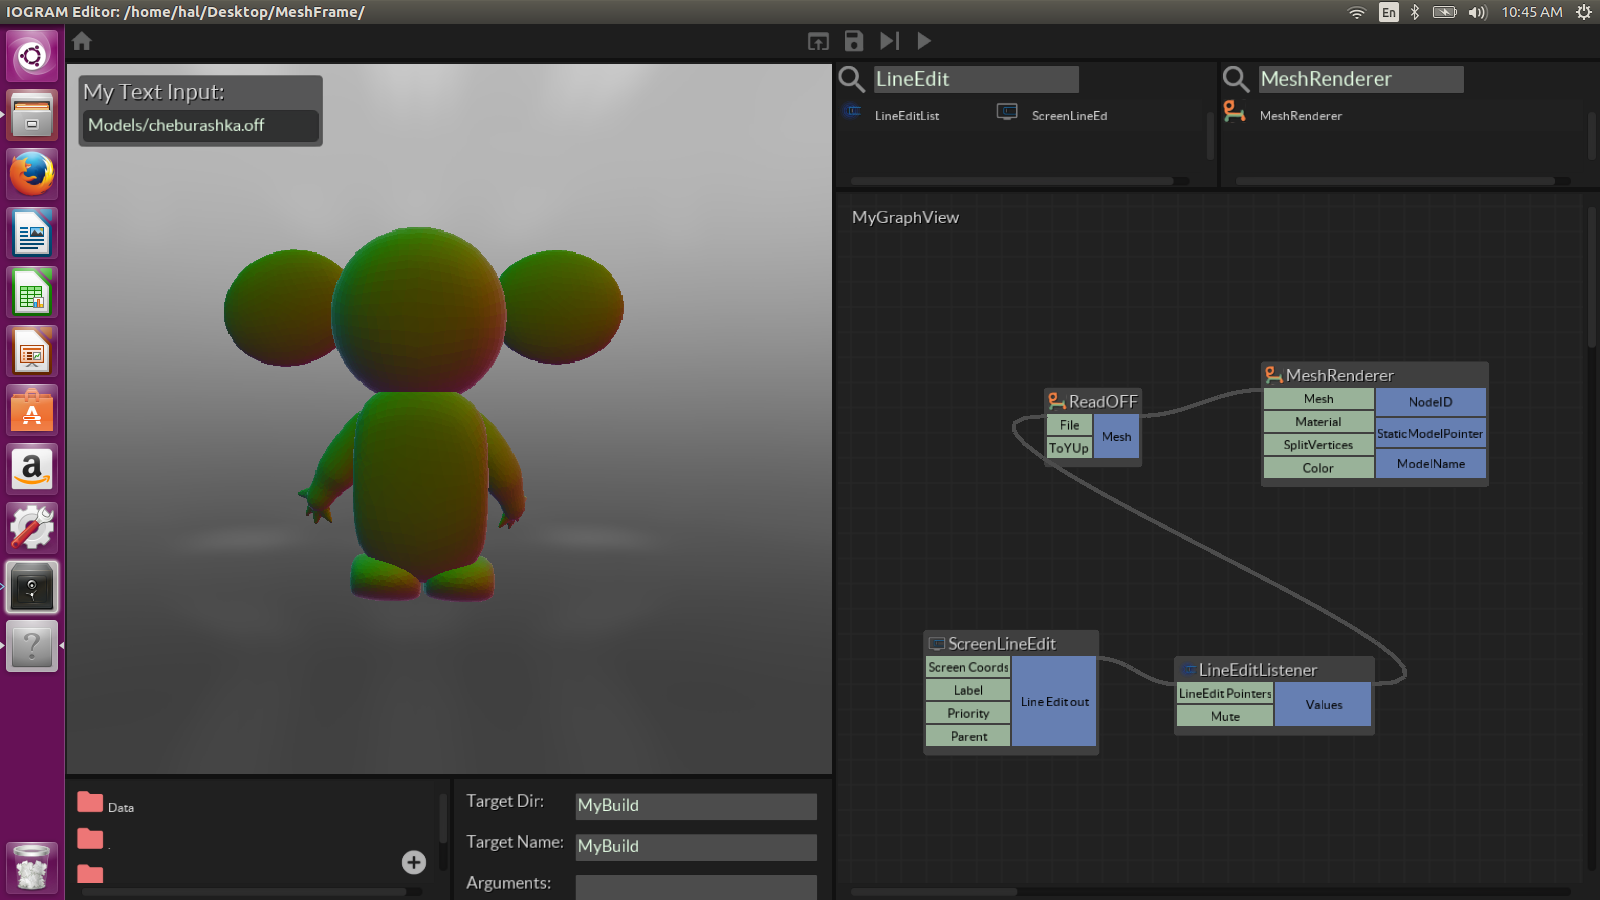
Search for "LineEdit" in the component library. Your search will turn up two components, LineEditListener and ScreenLineEdit. This component pair illustrates a key Iogram idiom used to gather input from the end-user: a "Screen" component that creates a user interface element in the 3D scene view and a "Listener" component that listens for input from the user interface element.
Drag one ScreenLineEdit component and one LineEditListener component onto your graph view. Check the 3D scene view to see that a user interface text entry element has appeared in the scene, with the default label "My Text Input".
Hook the blue "LineEditout" output slot on the ScreenLineEdit component to the green "LineEditPointers" input slot on the LineEditListener component. You can left mouse click and drag your components around to give them an orderly arrangement as the number of components in your graph grows. For most large component graphs, you will want to organize your components using Iogram's more advanced multiple graph views feature.
In the 3D scene view, type "Models/cheburashka.off" into the user interface text entry labelled "My Text Input".
Now right click the "Values" output slot to inspect the values stored there. If you entered "Models/cheburashka.off" into the "My Text Input" text entry in the 3D scene view, you should also see "Models/cheburashka.off" when you inspect the "Values" output slot of the LineEditListener component. To inspect the content stored in the "Values" output slot of LineEditListener, right click in the corresponding blue field. (Another way to inspect the contents at an output is to hook it up to a Panel component, which you can drop with the shortcut Alt + p. The Panel component displays its inputs in the body of the component. It also does double duty as a data entry field.)
Next, hook the blue "Values" output slot of the LineEditListener component to the green "Mesh file" input slot of the ReadTriangleMesh component. If all goes well, you will see the bumpy model replaced with the dreaded cheburashka.
It will appear quite small at first. The 3D scene view has the following controls:
Zoom: move the mouse while holding Ctrl + right mouse button
Rotate: move the mouse while holding the right mouse button
Pan: move the mouse while holding Shift + right mouse button
Add a slider for more end-user interaction
We will add a little more end-user interaction by introducing an input slider in the 3D scene that a user can use to adjust the scale of the rendered mesh.
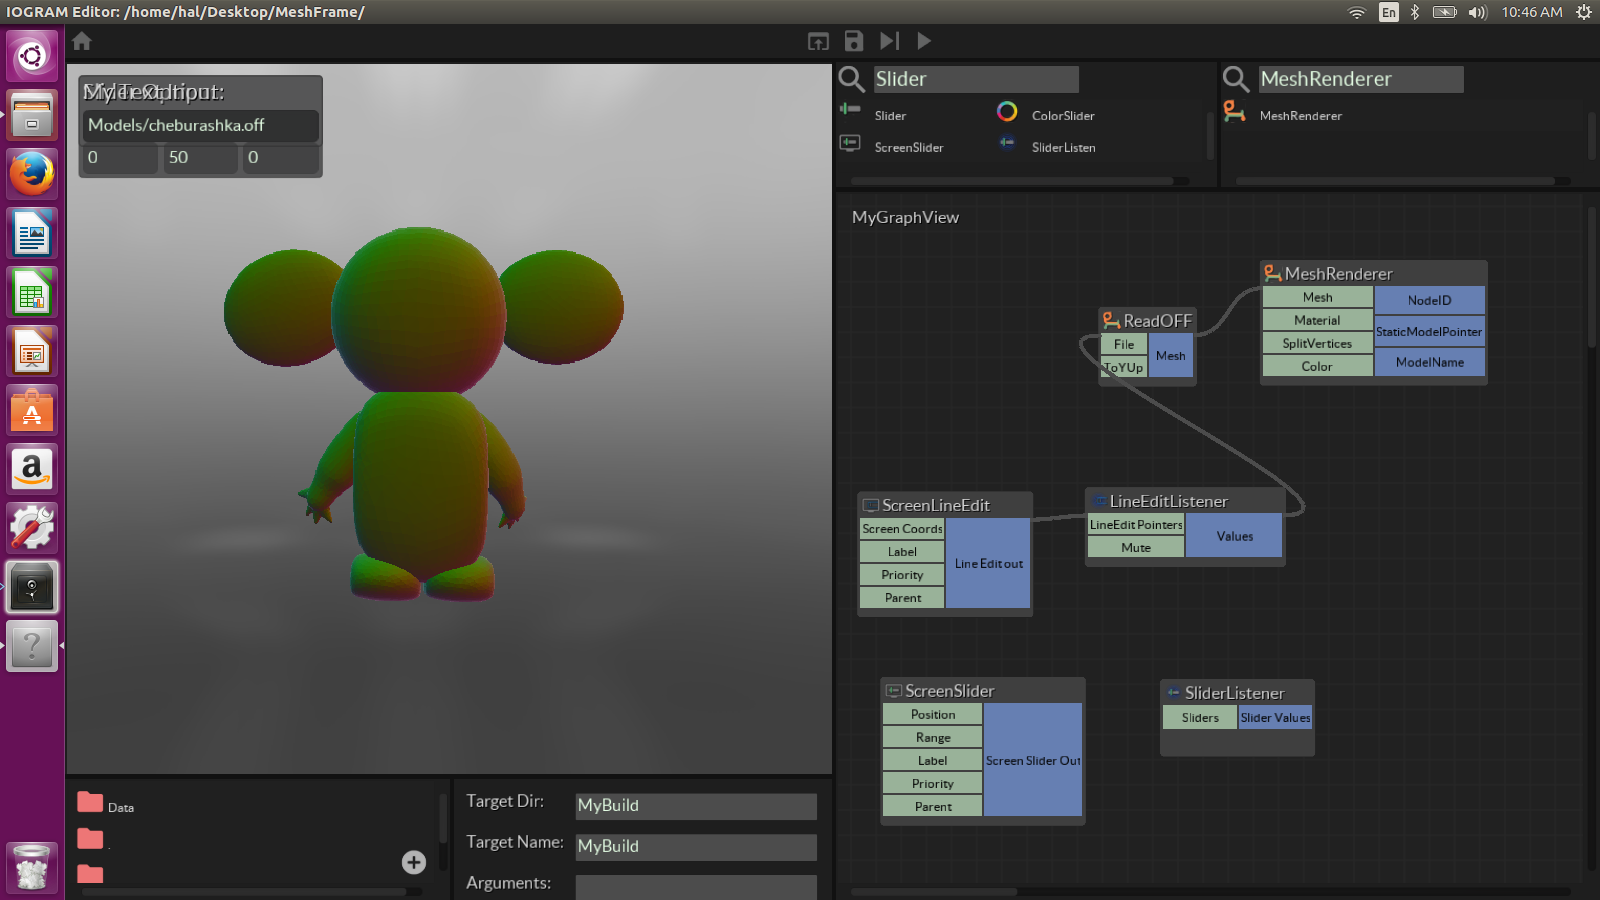
Search the component library for "Slider" and drag one ScreenSlider component and one SliderListener component onto your graph view. This is another example of the "Screen"/"Listener" component pattern for end user input. (Tip: there is also a Slider component for use directly in the graph view, and it's handy enough that we've configured the shortcut Alt + s to instantly drop one on the graph view.)
However, if you look closely you will see there is a problem. Look at the "My Text Input" text entry element you created earlier. The ScreenSlider's user interface element has landed in the scene right on top of it!
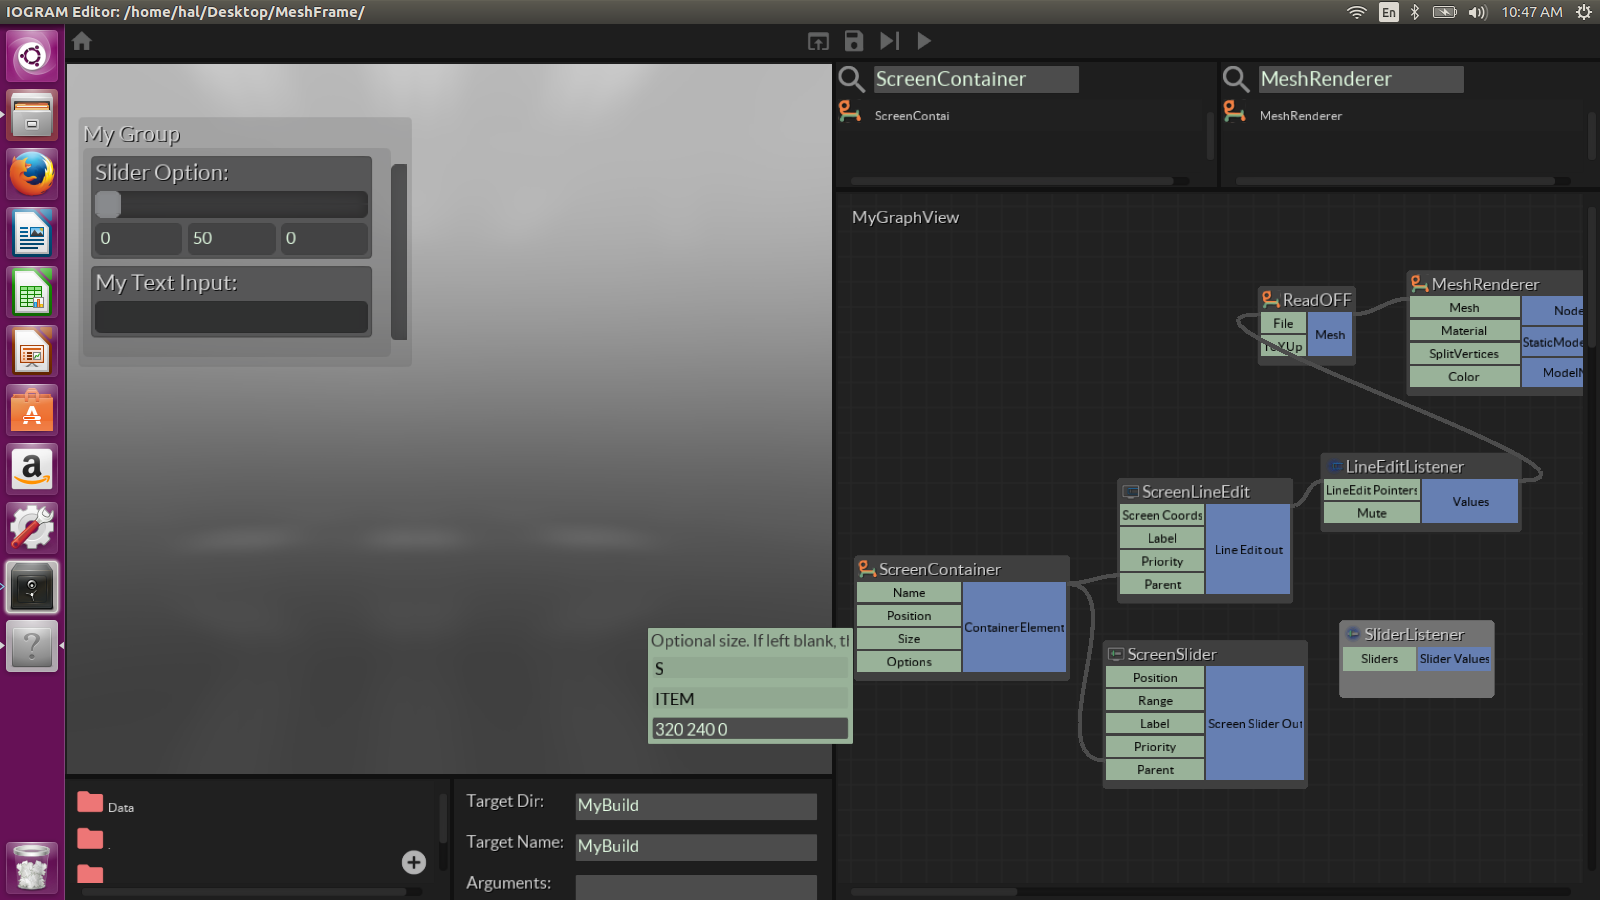
You can address such issues manually by adjusting inputs to the ScreenLineEdit and ScreenSlider components, but you can also use a ScreenContainer component as a convenient way to organize your user interface elements in the scene.
Search the component library for "ScreenContainer" and drag that component onto the graph view. Now connect the ScreenContainer's blue "ContainerElement" output slot to the green "Parent" input slot of both the ScreenLineEdit component and the ScreenSlider component. (Don't forget that you can drag your components around to make space, and don't forget to keep saving your work!)
If parenting the ScreenLineEdit to the ScreenContainer resets its text value, enter "Models/cheburashka.off" again in the user interface text entry element.
The user interface elements are organized for you in the screen container labelled "My Group". Try adjusting the size of the ScreenContainer at the "Size" input slot. Right click and enter "320 240 0". When you enter this, you are specifying a horizontal width of 320 and a vertical height of 240 for your screen container, but you are doing this by entering a vector with three coordinates. Three-coordinate vectors are used so much in Iogram that it is sometimes convenient to enter two input values as the first two coordinates in a three-coordinate vector.
Play around with the "Size" input to get used to the pattern and to find some dimensions you like.
Then use this trick again at the "Range" input slot of the ScreenSlider to change the slider's range from 0-50 to 0-1 (hint: enter "0 1 0").
Hook the ScreenSlider component's "Screen Slider Out" output slot to the SliderListener component's "Sliders" input slot. Drag the slider in the scene and right click the SliderListener component's "Slider Values" output slot to see how the SliderListener transmits the ScreenSlider's value to the component graph.
Frame the mesh with input from the slider
To make the slider have a real-time effect on the mesh geometry, search for "Frame" in a component library. Drag one Framecomponent onto your graph view.
Hook the SliderListener component's "SliderValues" output to the Frame component's "Inset Factor" input slot.
Then hook the ReadTriangleMesh component's "Mesh out" output to the MeshFrame component's "Mesh" input.
The "Mesh" output contains the result of applying the framing operation to the input mesh. Hook MeshFrame's "Mesh" output to the MeshRenderer component's "Mesh" input. (And, if you did not unhook ReadTriangleMesh's "Mesh out" input from MeshRenderer's "Mesh" input, watch how making a new connection there unhooks the connection previously in place.)
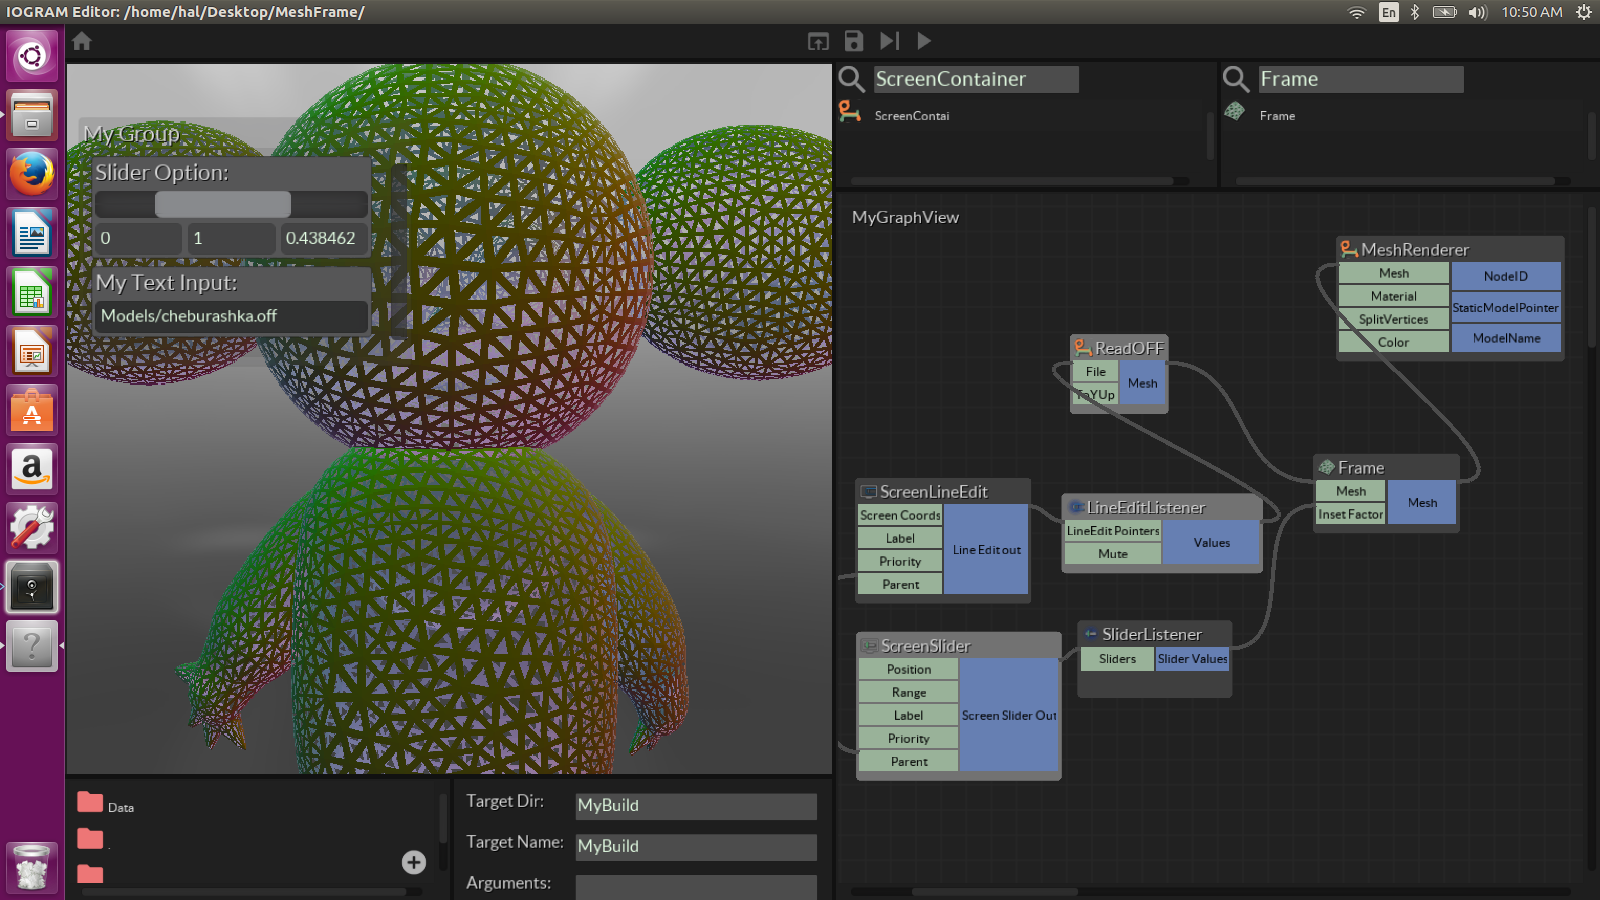
Now slide your slider around (that's what it's for!). If all goes well, you will see the holes in each mesh face shrink and expand in sync with the slider's values.
Export your application
Now it's time to export your prototype as a standalone application! First, save your work by clicking the save button (floppy disk icon) in the bar across the top of the editor.
Find the build menu view, which is positioned in the mid bottom left of the screen in the default Iogram editor workspace. Drag the border up (in the default workspace, this is the border between the build menu view and the 3D scene view) until you can see the entire build menu including the "Start Build" button in light red.
For both "Target Dir" and "Target Name" we will choose to override the default "MyBuild" and enter "MeshFrameApp" in both fields, but you can use whatever you like. What this means is that in the project directory (for us, MeshFrame) a new directory called MeshFrameApp will be created which will contain an executable file called MeshFrameApp (MeshFrameApp.exe on Windows) as well as the necessary project resources in two .pak files called CoreData.pak and Data.pak.
From the "Target" drop down menu choose the platform you are using to work through this tutorial. (You are by no means limited to exporting applications only to the platform on which you are running the editor, but for this tutorial we will want to test the exported application right away.)
When you are ready, click the light red button labelled "Start Build". Look in your project folder, and you should see a new folder called MeshFrameApp. This folder and the files it contains together make up the standalone application that the MeshFrame project has exported. You can share it and run it on another computer matching its target platform. (On Ubuntu, by default the exported binary file will not have permission to execute, so your users will have to allow this permission to run the application.)
Try out your application
You are ready to try out your exported application. Double click or otherwise launch the MeshFrameApp executable (MeshFrameApp.exe on Windows) that your project built inside the MeshFrameApp folder. When it launches, the application shows only the 3D view, including the user interface elements, but none of the editor workspace views.
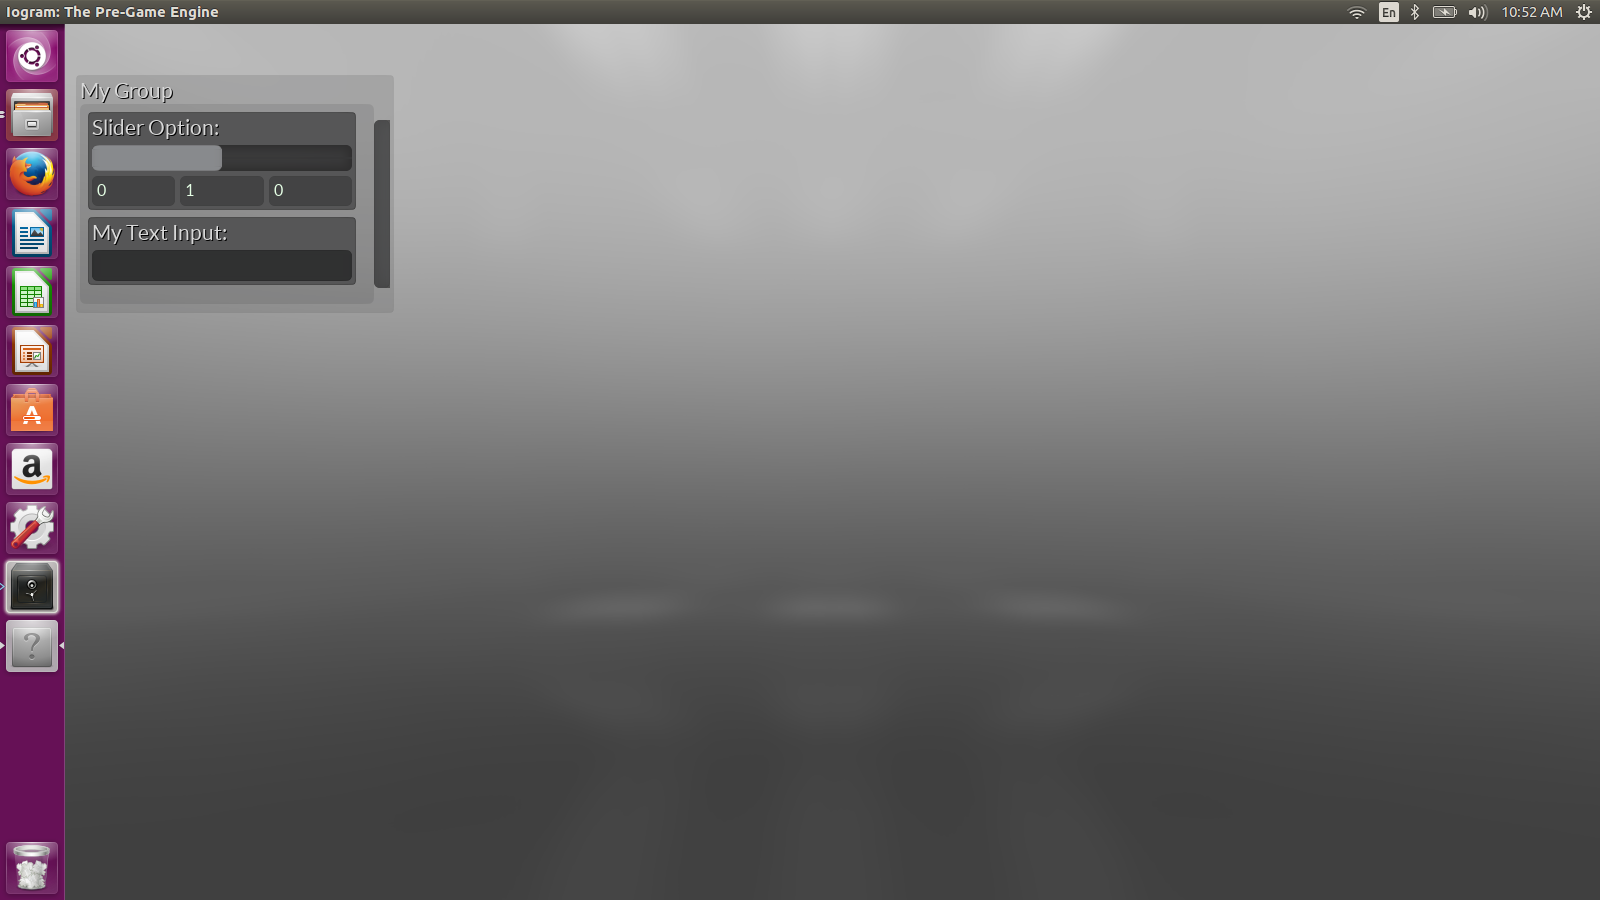
The view is blank because we haven't loaded a mesh yet and because the slider is at zero, which is an edge value for the framing operation.
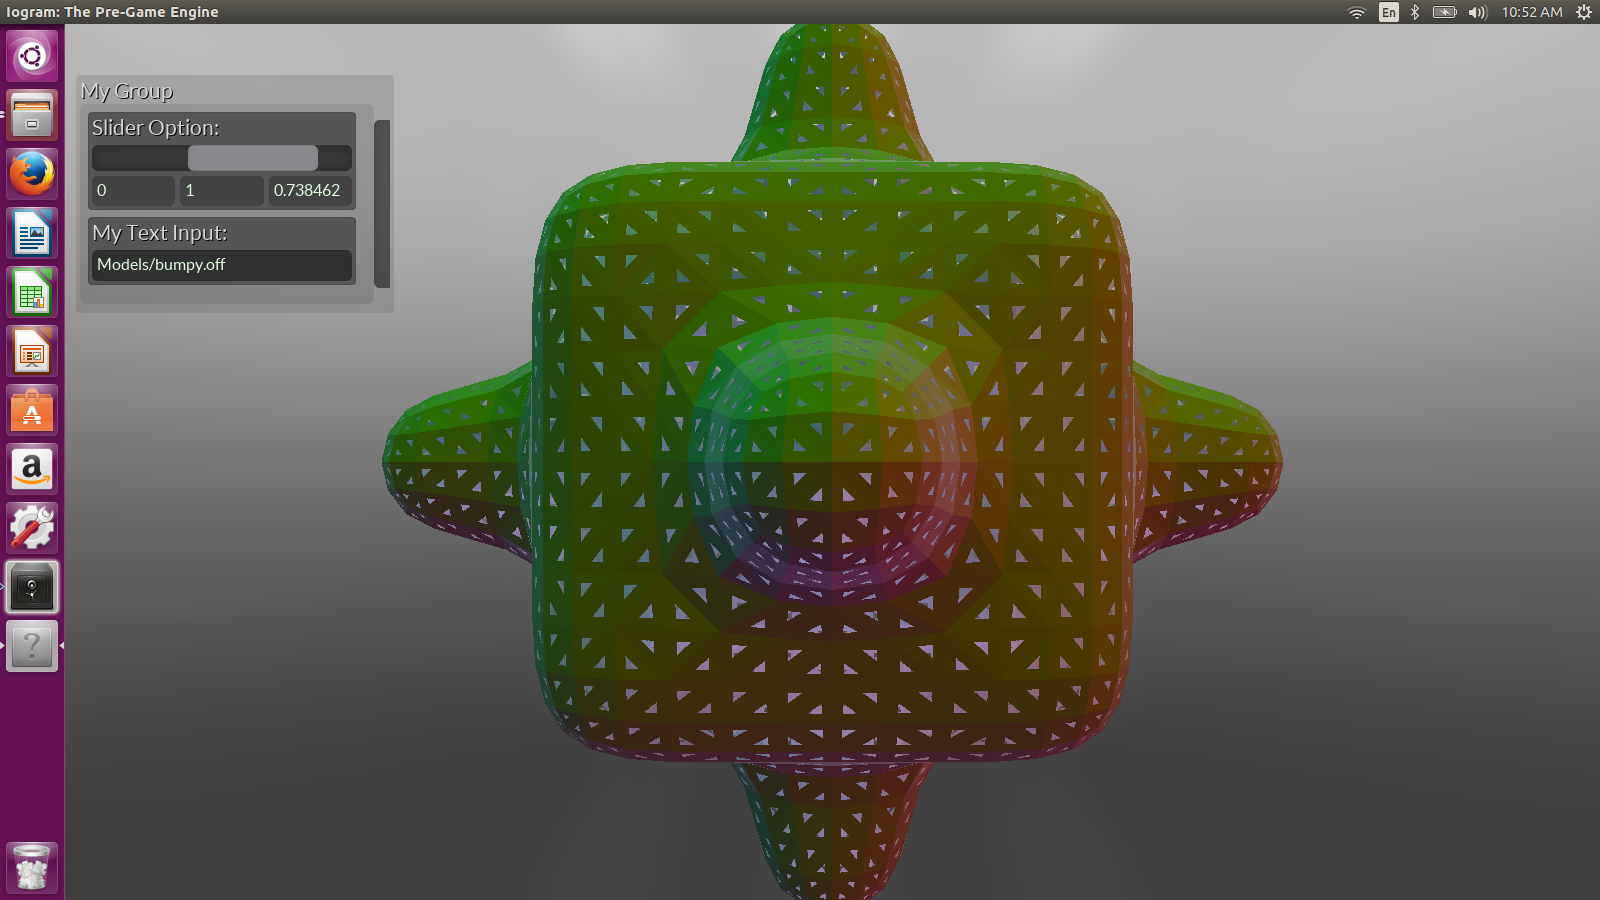
Go ahead and enter "Models/bumpy.off" in the text input and play around with the slider. We have made the bumpy model pretty large and the frames fairly thick.
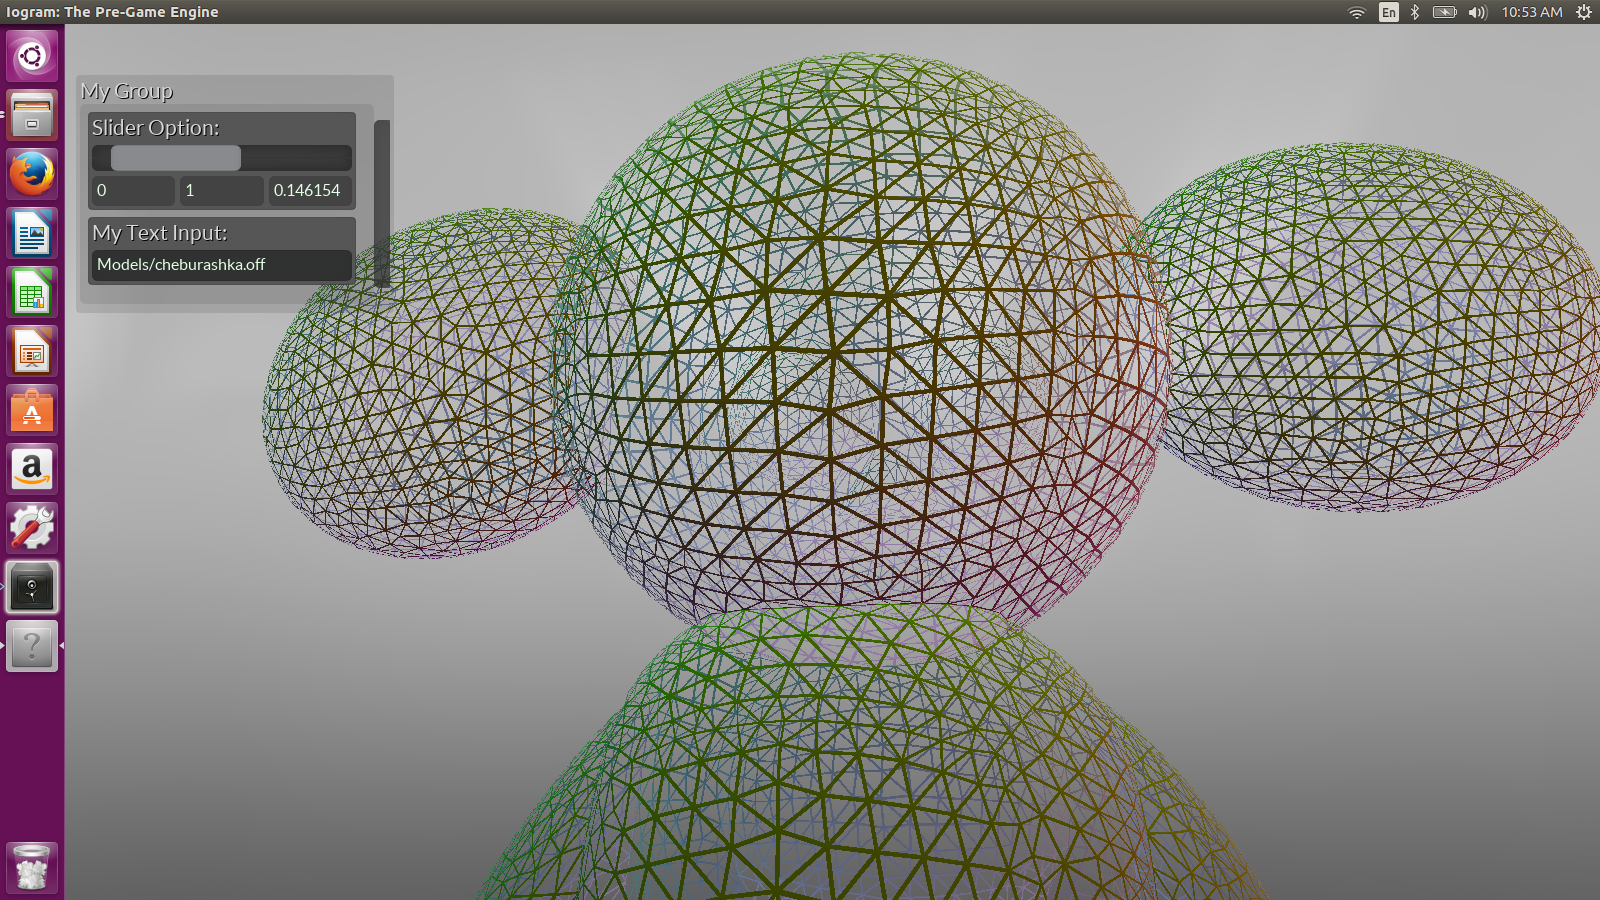
Now try loading "Models/cheburashka.off". If the cheburashka is small or hard to find, you can control the 3D scene view in the exported application the same way you can in the 3D scene view in the Iogram editor, with right mouse button to rotate, and with right mouse button plus Ctrl or Shift to zoom or pan respectively.
Extending a project
There are countless ways to extend a project like the one we have built so far. Even though we have already exported our project as an application, we can open up the project again (in case you closed it) to modify it and add to it. When you're ready to export another application, just repeat the build steps above.
We will extend our project by using the CloneNode component to populate the scene with a grid of copies of the mesh. But first, we will need to create the list of vectors whose coordinates specify the positions of each copy in the grid.
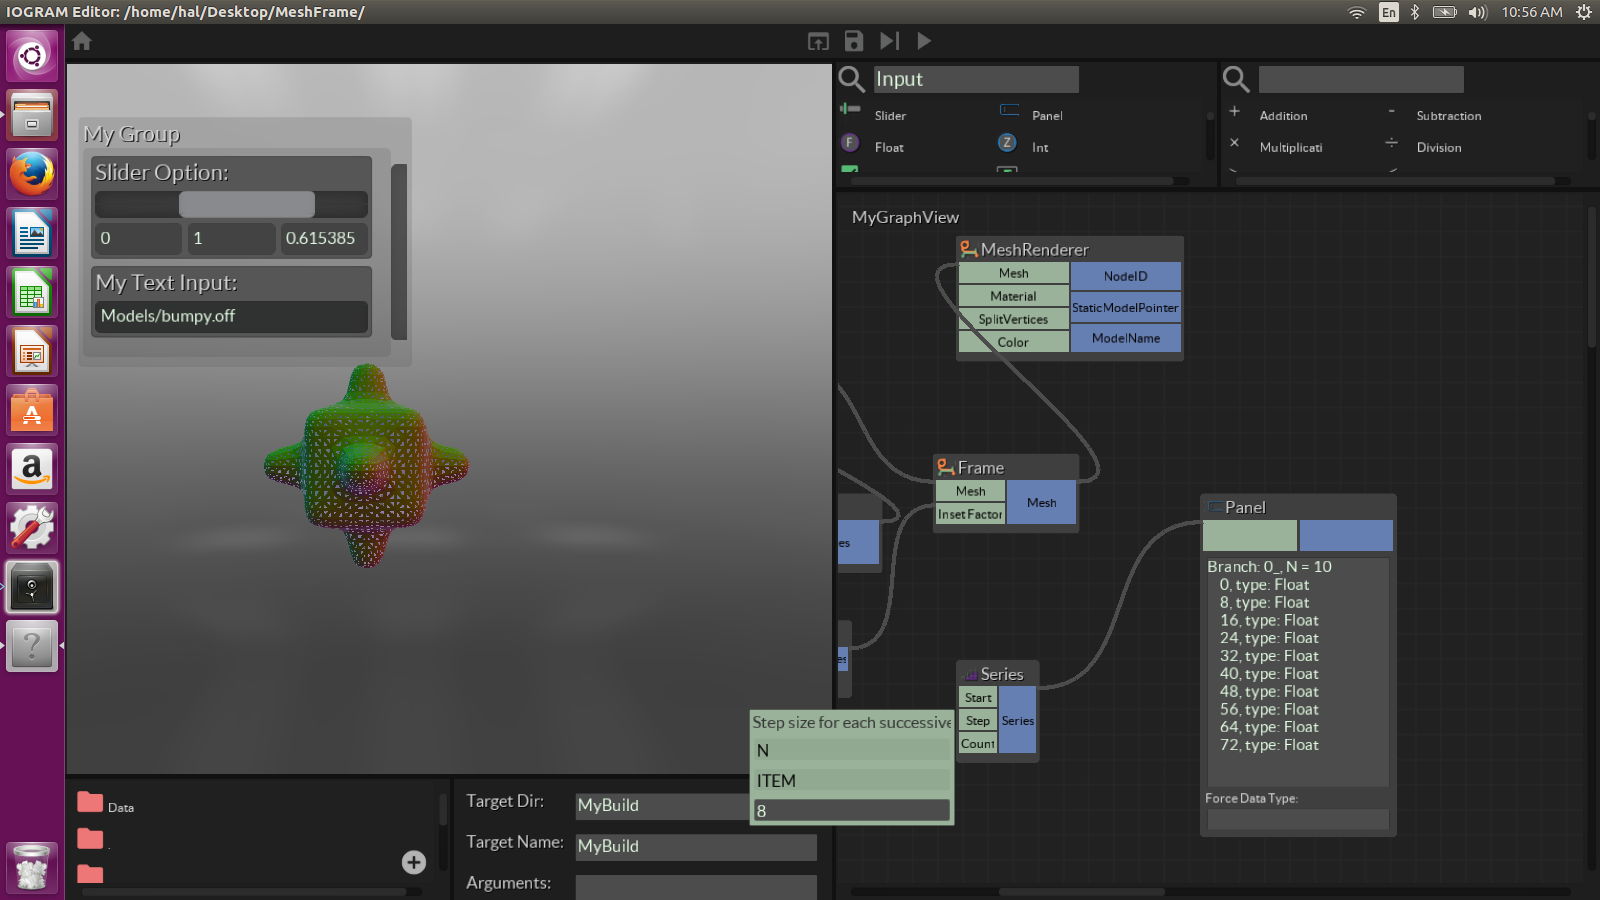
The Series component is useful for making lists of numbers, so search for it and drop a copy into the view. This is a good time to check out the Panel component as well. Drop one in your view and drag its bottom right corner to resize it.
At this point, you will probably want some fresh space to work with in your graph view. By holding the left mouse button on the workspace background, you can shift the graph view to center on some fresh space to work with.
Hook the Series component's "Series" output to Panel's unlabelled input slot. The contents stored in the "Series" output will appear in the body of the Panel component. When used this way, Panel doesn't have any effect on its input, but simply transmits its input to its unlabelled output slot, allowing you to inspect the input.
The Panel body gives us our first glimpse into Iogram's data tree structures. It tells us that the data tree at the "Series" output consists of only a single branch labelled "0_", and that that branch stores a list of floating point numbers: 0, 8, 16, 24, 32, 40, 48, 56, 64, 72.
Now search for and drop a Graft panel, and use it to intercept the "Series" output between Series and Panel, as shown below.

The Graft component performs the graft data tree operation on its input data tree, which basically takes any lists it finds stored at a branch and grows a new branch there for each item in the list. You don't have to fully understand it at this stage, but it may help to get another Panel and compare the original and the grafted data side by side.
When you have finished inspecting the data, you can delete your Panel components or move them out of the way in the workspace. To delete a component, click on it so that it gets highlighted, and press the delete button on your keyboard. Make sure no other components are highlighted when you press delete; you might want to get in the habit of clicking on the workspace background to deselect all components before you the select the one(s) you want to delete.
Now search for "ConstructVector" in a component library and drag one ConstructVector component onto the graph view. Hook the Series component's "Series" output to the "X" input slot of ConstructVector, and hook Graft's output slot to "Z". At this stage, there are a bunch of points to keep in mind:
Iogram is "Y-Up", so our choice of "X" and "Z" input slots is because we plan to make our grid horizontal;
At input slot "X", ConstructVector is receiving a data tree consisting of a single branch at which a list of ten floats is stored;
At input slot "Z", ConstructVector is receiving a data tree consisting of ten branches, each of which stores a list of only one float.
Don't worry, the ConstructVector component handles the bookkeeping required to synchronize the conflicting tree structures coming in at input slots "X" and "Z". In fact, every Iogram component does this bookkeeping by default. You will likely want to understand data trees in greater detail, but for now it is enough to know that ConstructVector has performed its operation 100 times, so that its "Vector3" output stores 100 vectors with coordinates corresponding to the points in a 10-by-10 grid.
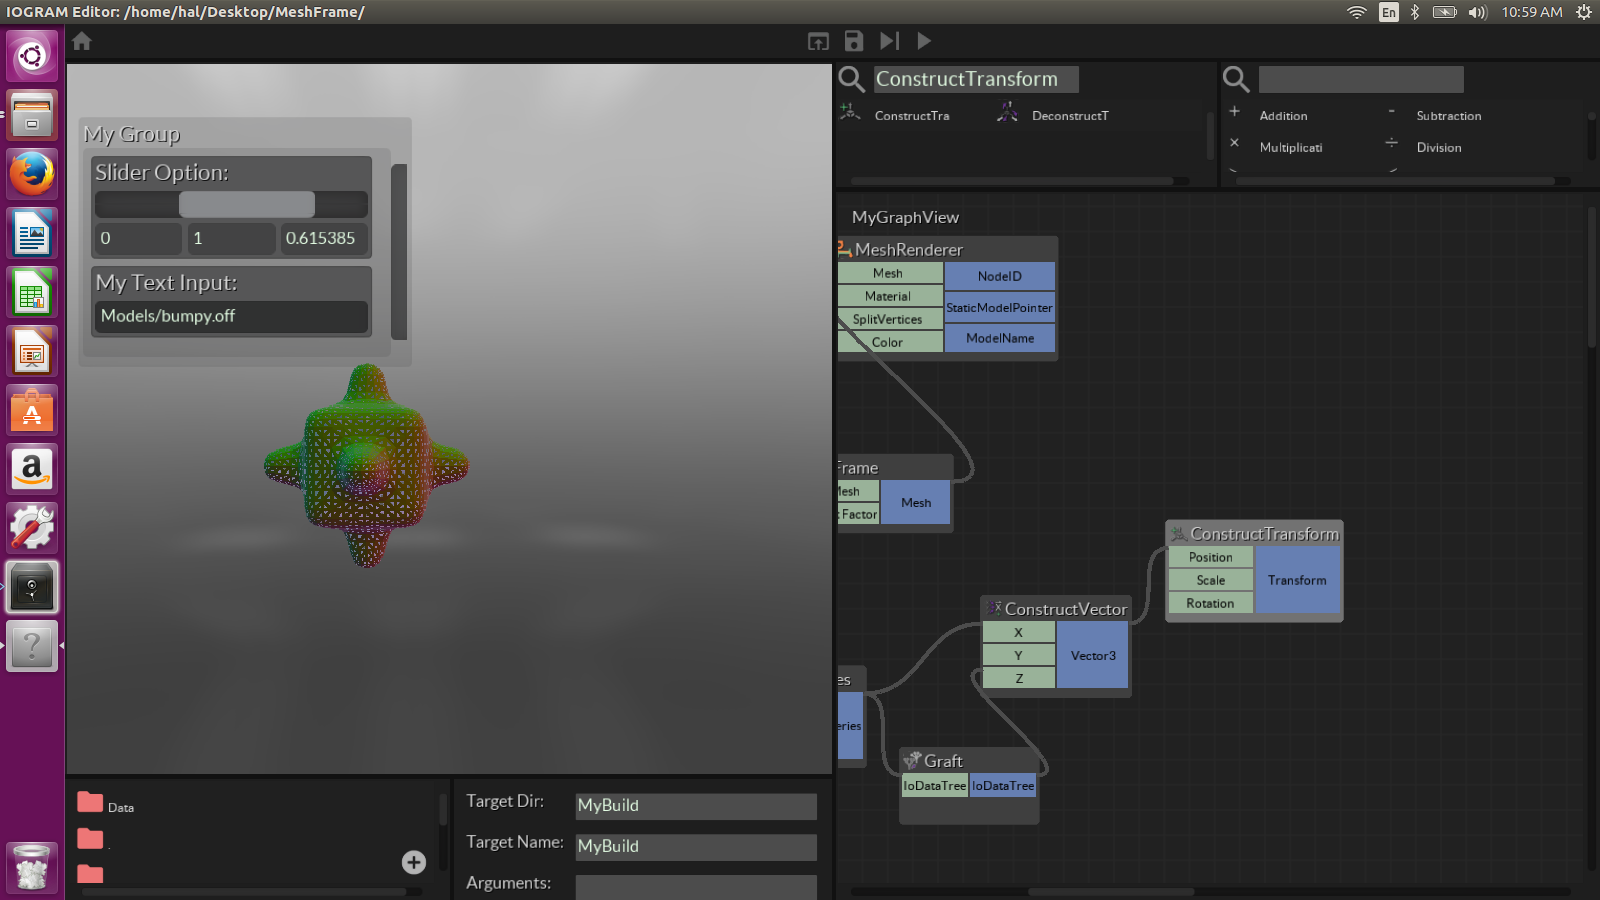
Now search for "Transform", and drag in one ConstructTransform component. The ConstructTransform component lets you construct a transformation as a mathematical object (a matrix!) by specifying "Position", "Scale", and "Rotation" inputs.
We only want to change the position of the mesh copies, so hook ConstructVector's "Vector3" output slot to ConstructTransform's "Position" input slot. Remember that, thanks to data trees, we are really connecting 100 vectors to the "Position" input, so that ConstructTransform's "Transform" output will likewise store 100 transformations after the component has performed its operation.
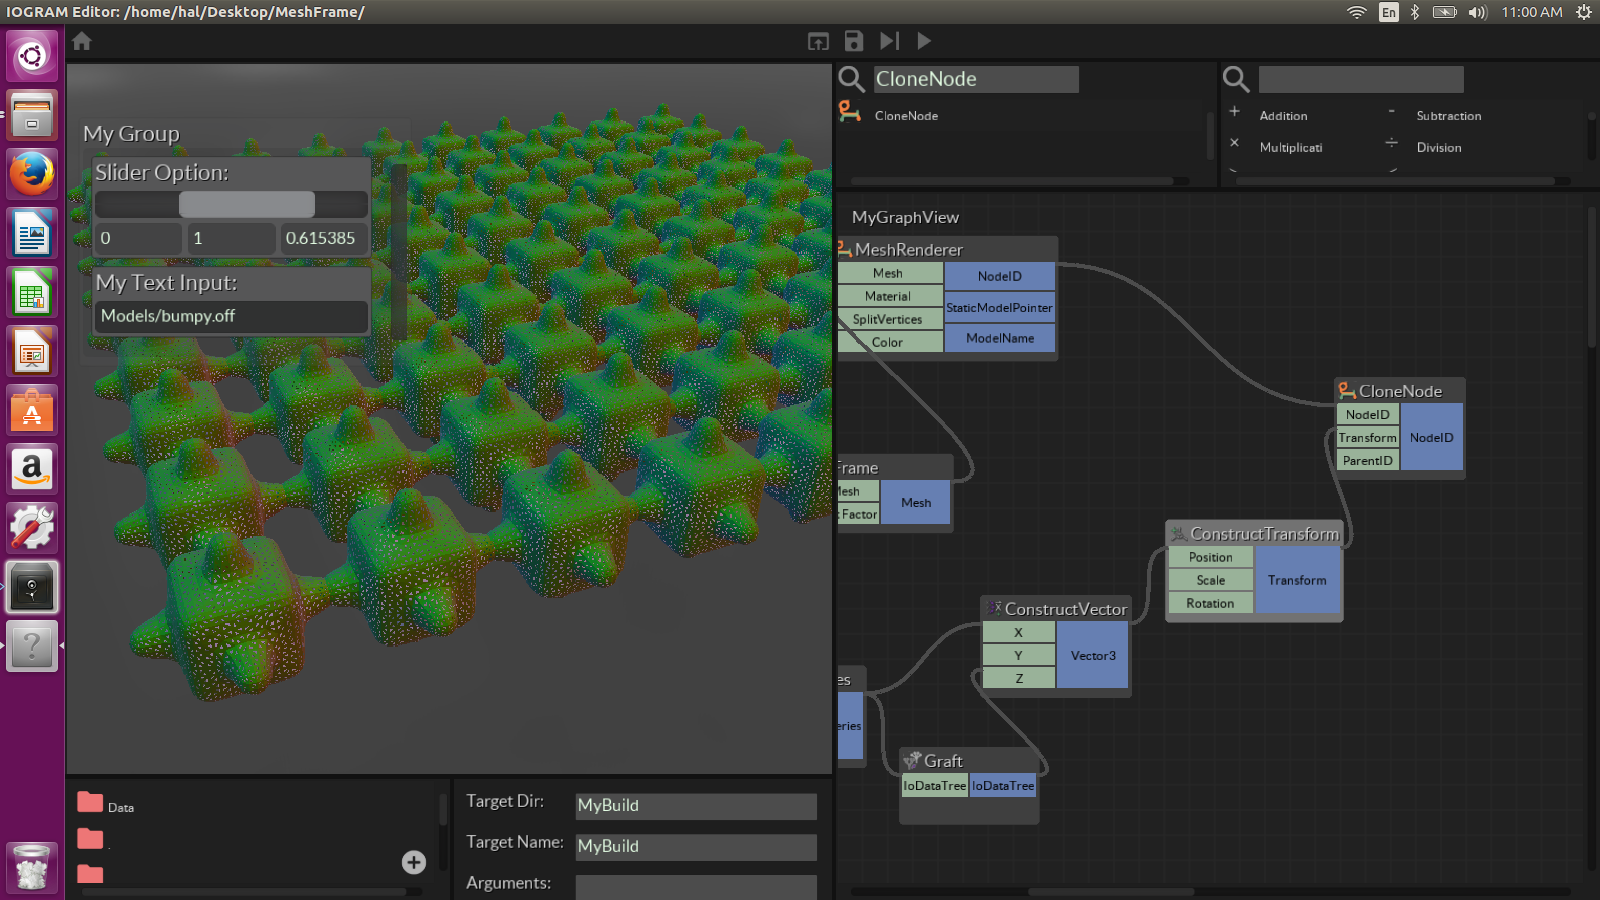
Search for "CloneNode" and drag a CloneNode component into the view. The CloneNode component takes as input the node ID of a node in the scene, and adds copies of that node to the scene, but in different positions. Join MeshRenderer's "NodeID" output to CloneNode's "NodeID" input. Also join ConstructTransform's "Transform" output to CloneNode's "Transform" input.
The 100 transformations coming in from ConstructTransform's "Transform" output cause the original node storing our mesh to be copied to 100 different positions in the scene. If all goes well, you will see copies of your mesh arranged in a grid in the scene. Adjust the "Step" input of the Seriescomponent to change the grid spacing.
Now go ahead and export your application once again. Or think of ways you could extend the end-user's interaction with the scene, and see if you can make it happen.
Component Groups
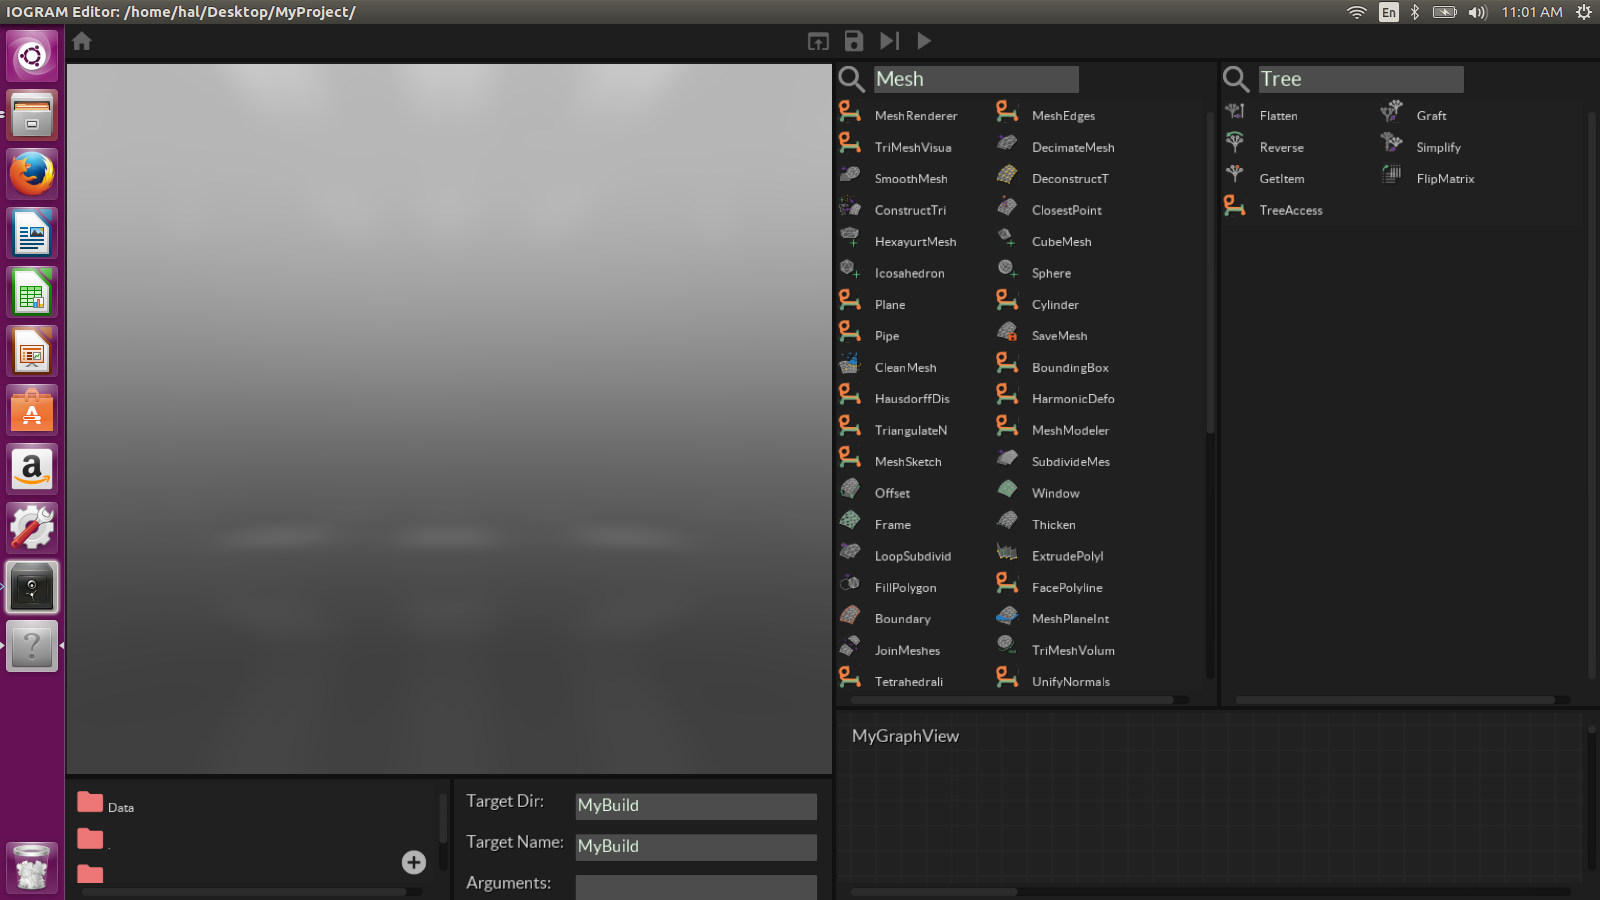
Most Iogram components are included in one of the component groups listed at the end of this section. To display all of a group's components in a component library, search for that group's name in the component library search bar.
For example, in the screen capture below, the first component library contains the components resulting after a search for "Mesh", while the second contains the results after a search for "Tree".
Advanced features
Your basic introduction to Iogram is complete, but as you use Iogram it will be helpful to keep in mind a few more advanced features of Iogram. We merely mention them here, so you will be aware of them as you experiment with Iogram.
Configuring editor view
You can resize existing views by dragging the border between them. Moreover, you can add a new view by splitting an existing one.
To do so, click anywhere along the top right border of an existing view, just below where you would click to drag the border. A view command toolbar will appear along the vertical border of the view. Look for the icons in the left of the bar. Choose either the horizontal or vertical split icon to split your view.
Play around with splitting views and resizing them. You will find the recursive splitting pattern becomes pretty intuitive after a while.
Data trees
Iogram components organize inputs and outputs according to a "data tree" pattern, which is a kind of bookkeeping that lets each Iogram component perform its operation on many sets of inputs at once. It's pretty complicated, and you can mostly ignore it when you're just starting out, but for power users data trees are an essential efficiency tool.
Scripting
One way to write custom Iogram components is with theScriptInstancecomponent, which lets you write a custom AngelScript program to define that component's operation.
Further Resources
Iogram (and its documentation!) is a work in progress, so stay tuned for updates. In the meantime, check out these other resources to get started.
Online component documentation giving you a list of all available Iogram components
a tutorial videoif you'd prefer to see Iogram in real-time.